Science 8th grade
UNIT 8: Mixtures 8.7 Solubility investigation
Science 8th grade
UNIT 8: Mixtures 8.7 Solubility investigation
Dissolving salt in water
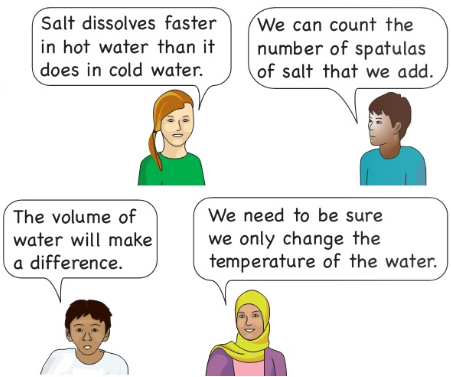
These students are discussing ways to investigate how temperature affects the amount of salt that will dissolve in water.
Questions
SE: 1) Which variables have the students identified?
SE: 2) How do you think the volume of water will affect the results if it is not kept the same? Explain your answer.
Carrying out the investigation
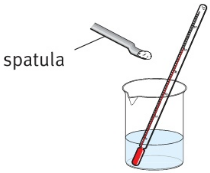
The students decide to count the number of spatulas of salt that will dissolve in 50 cm of water. They will repeat the experiment at different temperatures from ${20^ \circ }C$ to ${80^ \circ }C$.
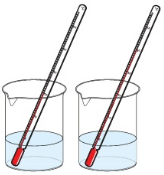
The variable they change is the temperature of the water.
They will count the number of spatulas of salt that will dissolve. This is the variable that depends on the water temperature.
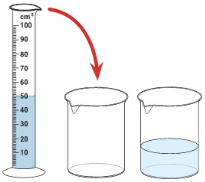
The volume of water is a variable that the students keep the same so that the test is fair.
The variable you change is called the independent variable. The variable you measure as the result is called the dependent variable. The variables you keep the same are called the control variables.
|
|
Plotting a graph of your results
When you plot a graph of your results the independent variable always goes along the horizontal axis.
Questions
SE: 3) Which variable is the independent variable in the students' experiment?
SE: 4) Which variable is a control variable in the students' experiment? Is there any other variable that needs to be controlled? (Hint: think about the spatula.)
SE: 5) Which is the dependent variable in this experiment?
SE: 6) What would be the label on the vertical axis of a graph of the results of this experiment?
Activity 8.7A (Planning an investigation)
SE: You are going to investigate the effect of changing the temperature of water on the amount of salt that can be dissolved in it.
Discuss in your group the plan for your investigation.
You need to consider the variables. You need to consider:
• how you will change the temperature of the water and keep it al that temperature while you add the salt.
• the range of temperatures you will use. (The highest and lowest temperatures you will use.)
• the interval between the temperatures. (Will you use ${10^ \circ }C$ gaps between the temperatures or ${5^ \circ }C$?)
What will you do to keep safe as you do your investigation?
You need to prepare a table for the results.
Discuss the plan with your teacher before you carry it out.
Activity 8.7B (Carrying out the investigation)
SE: 1) Carry out the investigation.
2) Record the results in a suitable table.
3) Plot an appropriate graph.
4) Explain what you have found out.