Science 8th grade
UNIT 10: Measuring motion 10.4 Pattern of movement
Science 8th grade
UNIT 10: Measuring motion 10.4 Pattern of movement
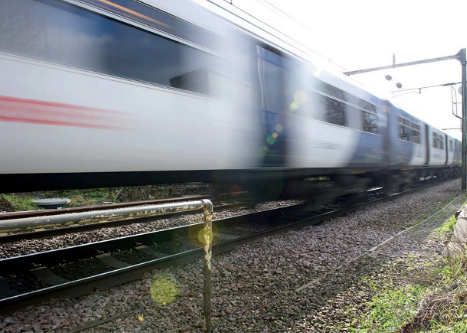
The train in the photograph is moving You can tell this because it looks blurred. The grass is not blurred because it is stationary.
The train looks blurred because it takes the camera a fraction of a second to take the picture. During this time, the train moves.
Question
1) A photographer takes a picture of a train which is travelling at $40m/s$.
If the camera takes 0.01s to take the picture, how far does the train travel in this time?
Constant speed, changing speed
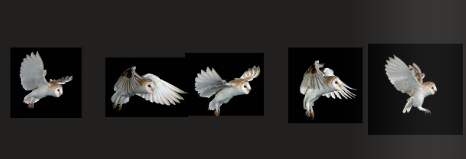
The next photograph shows an owl flying. There is only one owl, not five, The camera has taken five pictures, one after the other. They were taken at equal intervals of time.
From the photograph, you can tell that the owl is flying from left to right. You can also tell that it is flying at a constant speed, because the pictures are equally spaced.
The next photograph shows a steel ball bearing rolling down a slope. The images of the ball bearing get farther apart as it runs down the slope. This shows that the ball bearing is speeding up.
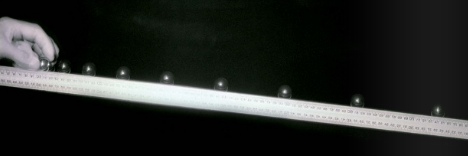
So equal spacings tell us that an object is moving at a steady speed.
Increasing spacings tell us that it is speeding up.
Question
2) Imagine that you are able to take a photograph of a rolling ball which is slowing down. What pattern would you expect to see? Make a sketch to show your idea.
Activity 10.4 (Ticker timer)
A ticker timer is a piece of apparatus which records how something is moving. The moving object pulls a long paper tape behind it. The ticker timer prints dots on the tape at cqual intervals of time.
Use a ticker timer to record the motion of some moving objects. Make tapes that show the patterns of movement of objects which are travelling at a steady speed, speeding up, and slowing down.
Distance/time graphs
Another way to show how an object is moving is to draw a distance/time graph. Distance is shown on the s-axis and time on the x-axis.
If an object is moving at a steady speed, the graph will be a straight line sloping upwards -see Graph A. This shows that the object's distance from the starting point increases at a steady rate. It is travelling equal distances in equal times.
Graph B shows the distance/time graphs for two cars. The red car is going faster than the blue one. Its graph line slopes upwards more steeply, because it travels a greater distance in each second.
Graph C is for an object which is speeding up. Its distance/time graph curves upwards.
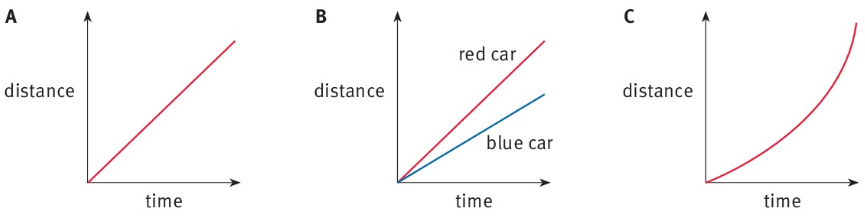
Distance/time graphs for some moving objects.
Question
$A+I$: 3) Imagine that you are walking along slowly. Then you start to run fast.
Make a sketch of a distance/time graph to represent this movement.