Physics A Level
Chapter 1: Kinematics 1.1 Speed
Physics A Level
Chapter 1: Kinematics 1.1 Speed

We can calculate the average speed of something moving if we know the distance it moves and the time it takes:
$average\,\,speed = \frac{{dis\tan ce}}{{time}}$
In symbols, this is written as:
$v = \frac{d}{t}$
where v is the average speed and d is the distance travelled in time t.
If an object is moving at a constant speed, this equation will give us its speed during the time taken. If its speed is changing, then the equation gives us its average speed. Average speed is calculated over a period of time.
If you look at the speedometer in a car, it doesn’t tell you the car’s average speed; rather, it tells you its speed at the instant when you look at it. This is the car’s instantaneous speed.
Question
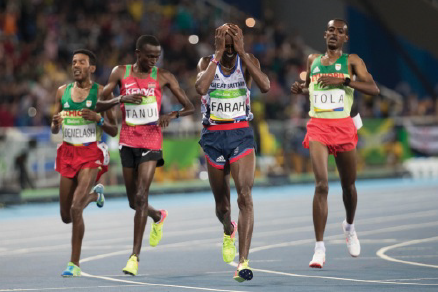
1) Look at Figure 1.2. The runner has just run $10000 m$ in a time of 27 minutes $5.17 s$. Calculate his
average speed during the race.
Units
In the Système Internationale d’Unités (the SI system), distance is measured in metres (m) and time in seconds (s). Therefore, speed is in metres per second. This is written as $m\,{s^{ - 1}}$ (or as $m/s$). Here, ${s^{ - 1}}$ is the same as $1.s$, or ‘per second’.
There are many other units used for speed. The choice of unit depends on the situation. You would probably give the speed of a snail in different units from the speed of a racing car. Table 1.1 includes some alternative units of speed.
Note that in many calculations it is necessary to work in SI units $(m\,{s^{ - 1}})$.
Table 1.1: Units of speed.
| metres per second | $m\,{s^{ - 1}}$ |
| centimetres per second | $cm\,{s^{ - 1}}$ |
| kilometres per second | $km\,{s^{ - 1}}$ |
| kilometres per hour | $km\,{h^{ - 1}}$ or $km/h$ |
| miles per hour | $mph$ |
Questions
2) Here are some units of speed:
$m\,{s^{ - 1}}\,\,mm\,{s^{ - 1}}\,\,km\,{s^{ - 1}}\,\,km\,{h^{ - 1}}$
Which of these units would be appropriate when stating the speed of each of the following?
a: a tortoise
b: a car on a long journey
c: light
d: a sprinter.
3) A snail crawls $12 cm$ in one minute. What is its average speed in $mm\,{s^{ - 1}}$?
Determining speed
You can find the speed of something moving by measuring the time it takes to travel between two fixed points. For example, some motorways have emergency telephones every $2000 m$. Using a stopwatch you can time a car over this distance. Note that this can only tell you the car’s average speed between the two points. You cannot tell whether it was increasing its speed, slowing down or moving at a constant speed.
PRACTICAL ACTIVITY 1.1
Laboratory measurements of speed
Here we describe four different ways to measure the speed of a trolley in the laboratory as it travels along a straight line. Each can be adapted to measure the speed of other moving objects, such as a glider on an air track or a falling mass.
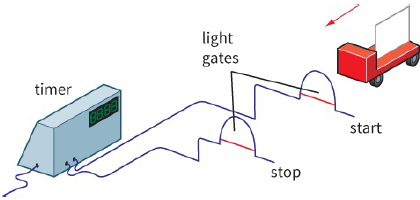
Measuring speed using two light gates
The leading edge of the card in Figure 1.3 breaks the light beam as it passes the first light gate. This starts the timer. The timer stops when the front of the card breaks the second beam. The trolley’s speed is calculated from the time interval and the distance between the light gates.
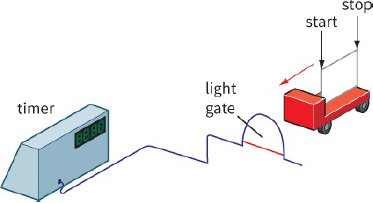
Measuring speed using one light gate
The timer in Figure 1.4 starts when the leading edge of the card breaks the light beam. It stops when the trailing edge passes through. In this case, the time shown is the time taken for the trolley to travel a distance equal to the length of the card. The computer software can calculate the speed directly by dividing the distance by the time taken.
Measuring speed using a ticker-timer
The ticker-timer (Figure 1.5) marks dots on the tape at regular intervals, usually s (i.e. $0.02 s$). (This is because it works with alternating current, and in most countries the frequency of the alternating mains is $50 Hz$.) The pattern of dots acts as a record of the trolley’s movement.
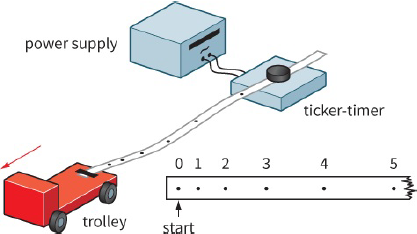
Start by inspecting the tape. This will give you a description of the trolley’s movement. Identify the start of the tape. Then, look at the spacing of the dots:
- even spacing – constant speed
- increasing spacing – increasing speed.
Now you can make some measurements. Measure the distance of every fifth dot from the start of the tape. This will give you the trolley’s distance at intervals of $0.10 s$. Put the measurements in a table and draw a distance–time graph.
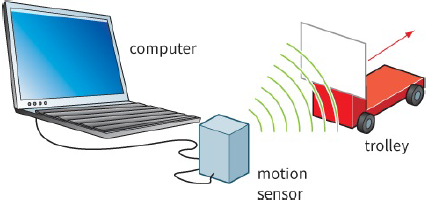
Measuring speed using a motion sensor
The motion sensor (Figure 1.6) transmits regular pulses of ultrasound at the trolley. It detects the reflected waves and determines the time they took for the trip to the trolley and back. From this, the computer can deduce the distance to the trolley from the motion sensor. It can generate a distance– time graph. You can determine the speed of the trolley from this graph.
Choosing the best method
Each of these methods for finding the speed of a trolley has its merits. In choosing a method, you might think about the following points:
- Does the method give an average value of speed or can it be used to give the speed of the trolley at different points along its journey?
- How precisely does the method measure time–to the nearest millisecond?
- How simple and convenient is the method to set up in the laboratory?
Questions
4) A trolley with a $5.0 cm$ long card passed through a single light gate. The time recorded by a digital timer was $0.40 s$. What was the average speed of the trolley in $m\,{s^{ - 1}}$?
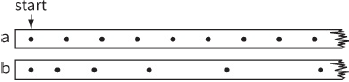
5) Figure 1.7 shows two ticker-tapes. Describe the motion of the trolleys that produced them.
6) Four methods for determining the speed of a moving trolley have been described. Each could be adapted to investigate the motion of a falling mass. Choose two methods that you think would be suitable, and write a paragraph for each to say how you would adapt it for this purpose.