Physics A Level | Chapter 1: Kinematics 1.4 Displacement–time graphs
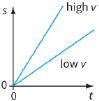
We can represent the changing position of a moving object by drawing a displacement–time graph. The gradient (slope) of the graph is equal to its velocity (Figure 1.9). The steeper the slope, the greater the velocity. A graph like this can also tell us if an object is moving forwards or backwards. If the gradient is negative, the object’s velocity is negative – it is moving backwards.
Deducing velocity from a displacement–time graph
A toy car moves along a straight track. Its displacement at different times is shown in Table 1.3. This data can be used to draw a displacement–time graph from which we can deduce the car’s velocity.
| 7.0 | 7.0 | 7.0 | 5.0 | 3.0 | 1.0 | Displacement $s/m$ |
| 5.0 | 4.0 | 3.0 | 2.0 | 1.0 | 0.0 | Time $t/s$ |
It is useful to look at the data first, to see the pattern of the car’s movement. In this case, the displacement increases steadily at first, but after $3.0 s$ it becomes constant. In other words, initially the car is moving at a steady velocity, but then it stops.
|

|
|

|

|
|
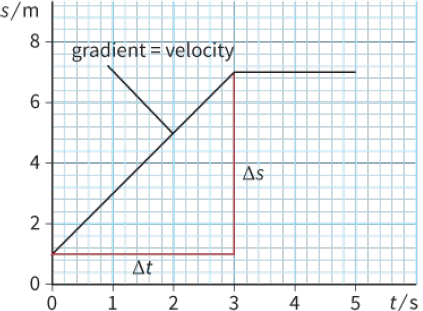
Now we can plot the displacement–time graph (Figure 1.10).
We want to work out the velocity of the car over the first 3.0 seconds. We can do this by working out the gradient of the graph, because:
velocity = gradient of displacement−time graph
We draw a right-angled triangle as shown. To find the car’s velocity, we divide the change in displacement by the change in time. These are given by the two sides of the triangle labelled $\Delta s$ and $\Delta t$.
$\begin{array}{l}
Velocity = \frac{{change\,in\,displacement}}{{time\,taken}}\\
= \frac{{\Delta s}}{{\Delta t}}\\
= \frac{{(7.0 - 1.0)}}{{(3.0 - 0)}}\\
= \frac{{6.0}}{{3.0}}\\
= 2.0\,m{s^{ - 1}}
\end{array}$
If you are used to finding the gradient of a graph, you may be able to reduce the number of steps in this calculation.
Questions
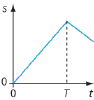
10) The displacement–time sketch graph in Figure 1.11 represents the journey of a bus. What does the graph tell you about the journey?
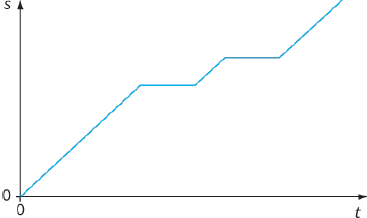
11) Sketch a displacement–time graph to show your motion for the following event. You are walking at a constant speed across a field after jumping off a gate. Suddenly you see a horse and stop. Your friend says there’s no danger, so you walk on at a reduced constant speed. The horse neighs, and you run back to the gate. Explain how each section of the walk relates to a section of your graph.
12) Table 1.4 shows the displacement of a racing car at different times as it travels along a straight track during a speed trial.
a: Determine the car’s velocity.
b: Draw a displacement–time graph and use it to find the car’s velocity
| Displacement / m | 0 | 85 | 170 | 255 | 340 |
| Time / s | 0 | 1.0 | 2.0 | 3.0 | 4.0 |
13) An old car travels due south. The distance it travels at hourly intervals is shown in Table 1.5.
a: Draw a distance–time graph to represent the car’s journey.
b: From the graph, deduce the car’s speed in $km\,{h^{ - 1}}$ during the first three hours of the journey.
c: What is the car’s average speed in $km\,{h^{ - 1}}$ during the whole journey?
| Time / h | 0 | 1 | 2 | 3 | 4 |
| Distance / km | 0 | 23 | 46 | 69 | 84 |