Physics A Level
Chapter 2: Accelerated motion 2.4 Deducing acceleration
Physics A Level
Chapter 2: Accelerated motion 2.4 Deducing acceleration
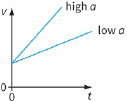
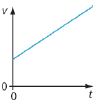
The gradient of a velocity–time graph tells us whether the object’s velocity has been changing at a high rate or a low rate, or not at all (Figure 2.4). We can deduce the value of the acceleration from the gradient of the graph:
acceleration = gradient of velocity–time graph
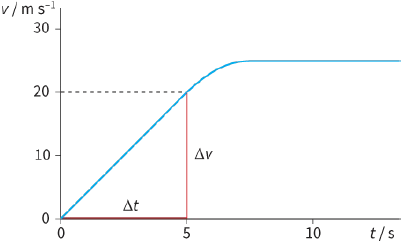
The graph (Figure 2.5) shows how the velocity of a cyclist changed during the start of a sprint race. We can find his acceleration during the first section of the graph (where the line is straight) using the triangle as shown.
The change in velocity $\Delta v$ is given by the vertical side of the triangle. The time taken $\Delta t$ is given by the horizontal side.
$\begin{array}{l}
acceleration = \frac{{change\,in\,velocity}}{{time\,taken}}\\
= \frac{{25 - 0}}{5}\\
= 4.0\,m\,{s^{ - 2}}
\end{array}$
A more complex example where the velocity–time graph is curved is shown in Figure 2.18.
|
|

|
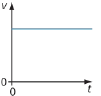
Therefore acceleration $a=0$ |

|
|