Physics A Level
Chapter 2: Accelerated motion 2.5 Deducing displacement
Physics A Level
Chapter 2: Accelerated motion 2.5 Deducing displacement
We can also find the displacement of a moving object from its velocity–time graph. This is given by the area under the graph:
displacement = area under velocity–time graph
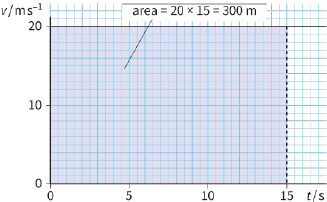
It is easy to see why this is the case for an object moving at a constant velocity. The displacement is simply velocity $ \times $ time, which is the area of the shaded rectangle (Figure 2.6a).
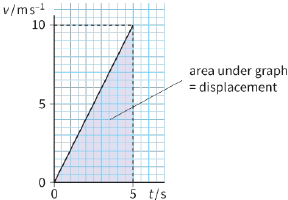
For changing velocity, again the area under the graph gives displacement (Figure 2.6b).
|
|
So, for this simple case in which the area is a triangle, we have:
$\begin{array}{l}
displacement = \frac{1}{2} \times base \times height\\
= \frac{1}{2} \times 5.0 \times 10\\
= 25m
\end{array}$
It is easy to confuse displacement–time graphs and velocity–time graphs. Check by looking at the quantity marked on the vertical axis.
For more complex graphs, you may have to use other techniques such as counting squares to deduce the area, but this is still equal to the displacement.
(Take care when counting squares: it is easiest when the sides of the squares stand for one unit. Check the axes, as the sides may represent 2 units, 5 units or some other number.)
Questions
4) A lorry driver is travelling at the speed limit on a motorway. Ahead, he sees hazard lights and gradually slows down. He sees that an accident has occurred, and brakes suddenly to a halt. Sketch a velocity–time graph to represent the motion of this lorry.
5) Table 2.1 shows how the velocity of a motorcyclist changed during a speed trial along a straight road.
a: Draw a velocity–time graph for this motion.
b: From the table, deduce the motorcyclist’s acceleration during the first $10 s$.
c: Check your answer by finding the gradient of the graph during the first $10 s$.
d: Determine the motorcyclist’s acceleration during the last $15 s$.
e: Use the graph to find the total distance travelled during the speed trial.
| 0 | 10 | 20 | 30 | 30 | 15 | 0 | $\,Velocity/m\,{s^{ - 1}}$ |
| 30 | 25 | 20 | 15 | 10 | 5 | 0 | Time / s |