Physics A Level
Chapter 2: Accelerated motion 2.7 Determining velocity and acceleration in the laboratory
Physics A Level
Chapter 2: Accelerated motion 2.7 Determining velocity and acceleration in the laboratory
In Chapter 1, we looked at ways of finding the velocity of a trolley moving in a straight line. These involved measuring distance and time, and deducing velocity. Practical Activity 2.1 shows how these techniques can be extended to find the acceleration of a trolley.
PRACTICAL ACTIVITY 2.1: LABORATORY MEASUREMENTS OF ACCELERATION
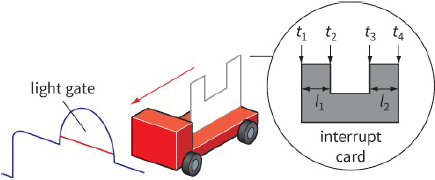
Measurements using light gates
The computer records the time for the first ‘interrupt’ section of the card to pass through the light beam of the light gate (Figure 2.8). Given the length of the interrupt, it can work out the trolley’s initial velocity u. This is repeated for the second interrupt to give final velocity v. The computer also records the time interval ${t_3} - {t_1}$ between these two velocity measurements. Now it can calculate the acceleration a as shown:
$u = \frac{{{t_1}}}{{{t_2} - {t_1}}}$
(${l_1} = $ length of first section of the interrupt card)
and
$v = \frac{{{t_2}}}{{{t_4} - {t_{13}}}}$
(${l_2} = $ length of second section of the interrupt card)
Therefore:
$\begin{array}{l}
a = \frac{{change\,in\,velocity}}{{time\,taken}}\\
= \frac{{v - u}}{{{t_3} - {t_1}}}
\end{array}$
(Note that this calculation gives only an approximate value for a. This is because u and v are average speeds over a period of time; for an accurate answer we would need to know the speeds at times ${t_1} $ and ${t_3} $.)
Sometimes two light gates are used with a card of length l. The computer can still record the times as shown and calculate the acceleration in the same way, with ${l_1} = {l_2} = l$.
Measurements using a ticker-timer
The practical arrangement is the same as for measuring velocity. Now we have to think about how to interpret the tape produced by an accelerating trolley (Figure 2.9).
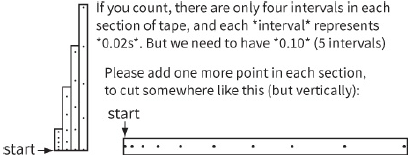
The tape is divided into sections, as before, every five dots. Remember that the time interval between adjacent dots is $0.02 s$. Each section represents $0.10 s$.
By placing the sections of tape side by side, you can picture the velocity–time graph.
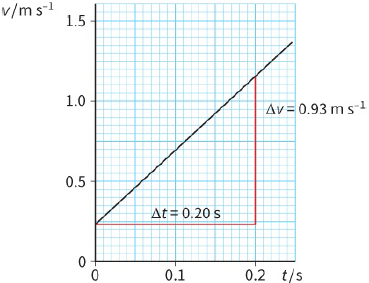
The length of each section gives the trolley’s displacement in $0.10 s$, from which the average velocity during this time can be found. This can be repeated for each section of the tape, and a velocity–time graph drawn. The gradient of this graph is equal to the acceleration. Table 2.2 and Figure 2.10 show some typical results.
The acceleration is calculated to be:
$\begin{array}{l}
a = \frac{{\Delta v}}{{\Delta t}}\\
= \frac{{0.93}}{{0.20}}\\
\approx 4.7\,m\,{s^{ - 2}}
\end{array}$
| ${\rm{Velocity}}\,/\,m\,{s^{ - 1}}$ | Length of section / cm |
Time interval / s | Time at start / s | Section of tape |
| 0.23 | 2.3 | 0.10 | 0.0 | 1 |
| 0.70 | 7.0 | 0.10 | 0.10 | 2 |
| 1.16 | 11.6 | 0.10 | 0.20 | 3 |
Measurements using a motion sensor
The computer software that handles the data provided by the motion sensor can calculate the acceleration of a trolley. However, because it deduces velocity from measurements of position, and then calculates acceleration from values of velocity, its precision is relatively poor.
Questions
6) Sketch a section of ticker-tape for a trolley that travels at a steady velocity and then decelerates.
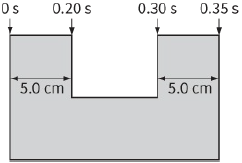
7) Figure 2.11 shows the dimensions of an interrupt card, together with the times recorded as it passed through a light gate. Use these measurements to calculate the acceleration of the card. (Follow the steps outlined in Practical Activity 2.1.)
8) Two adjacent five-dot sections of a ticker-tape measure 10 cm and 16 cm, respectively. The interval between dots is 0.02 s. Deduce the acceleration of the trolley that produced the tape.