Physics A Level
P1 Practical skills at AS Level P1.4 Precision, accuracy, errors and uncertainties
Physics A Level
P1 Practical skills at AS Level P1.4 Precision, accuracy, errors and uncertainties
- Chapter 1: Kinematics
- Chapter 2: Accelerated motion
- Chapter 3: Dynamics
- Chapter 4: Forces
- Chapter 5: Work, energy and power
- Chapter 6: Momentum
- Chapter 7: Matter and materials
- Chapter 8: Electric current
- Chapter 9: Kirchhoff’s laws
- Chapter 10: Resistance and resistivity
- Chapter 11: Practical circuits
- Chapter 12: Waves
- Chapter 13: Superposition of waves
- Chapter 14: Stationary waves
- Chapter 15: Atomic structure
- P1 Practical skills at AS Level
- Chapter 16: Circular motion
- Chapter 17: Gravitational fields
- Chapter 18: Oscillations
- Chapter 19: Thermal physics
- Chapter 20: Ideal gases
- Chapter 21: Uniform electric fields
- Chapter 22: Coulomb’s law
- Chapter 23: Capacitance
- Chapter 24: Magnetic fields and electromagnetism
- Chapter 25: Motion of charged particles
- Chapter 26: Electromagnetic induction
- Chapter 27: Alternating currents
- Chapter 28: Quantum physics
- Chapter 29: Nuclear physics
- Chapter 30: Medical imaging
- Chapter 31: Astronomy and cosmology
- P2 Practical skills at A Level
Whenever you make a measurement, you are trying to find the true value of a quantity. This is the value you would find if your measurement was perfect. However, no measurement can ever be perfect; there will always be some uncertainty. Your equipment may be imperfect or your technique may be capable of improvement. So, whenever you carry out practical work, you should think about two things:
how the equipment or your technique could be improved to give better results, with less uncertainty how to present the uncertainty in your findings.
As you will see later in this chapter, both of these need to be reflected in the way you present your findings.
We will first consider the precision of a measurement. The level of precision is high if you make several measurements of a quantity and they are all very similar. A precise measurement, when repeated, will be the same, or nearly so. However, if your measurements are spread widely around the average, they are less precise. This can arise because of practical difficulties in making the measurements.
Precision is reflected in how the results are recorded. If a distance is quoted as ‘$15 m$’ then it implies that it was only measured to the nearest metre, whereas if it is quoted as ‘$15.0 m$’ then it suggests that it was measured to the nearest $0.1 m$.
Take care not to confuse precision with accuracy. A measurement is described as ‘accurate’ if the value obtained is close to the true value. Even if a measurement is precise, and always produces the same result, it may not be accurate because every reading may have the same error. For example, you can make very precise measurements of the diameter of a wire using a micrometer screw gauge to the nearest $0.01 mm$, but every reading may be inaccurate if the gauge has a zero error.
Figure P1.5 shows two attempts at making holes in the centre of a target. Imagine that the positions of the holes represent readings, with the true value at the centre. On the left, the readings are close together so we can say that they are precise. However, they are not accurate as the average is far from the centre. In the second, the measurement can be said to be accurate as the average position of the holes is close to the centre, but the readings are not precise as the holes are spread out.
Whenever you make a measurement, you should be aware of the uncertainty in the measurement. It will often, but not always, be determined by the smallest division on the measuring instrument. On a metre rule, which is graduated in millimetres, we should be able to read to the nearest half millimetre, but beware! If we are measuring the length of a rod there are two readings to be taken, one at each end of the rod. Each of these readings has an uncertainty of $0.5 mm$, giving a total uncertainty of $1 mm$.

diagram represents readings that are accurate but without precision
The uncertainty will depend not only on the precision of the calibrations on the instrument you are using, but also on your ability to observe and on errors introduced by less than perfect equipment or poor technique in taking the observations. Here are some examples of where uncertainties might arise:
Systematic error – A spring on a force meter might, over time, become weaker so that the force meter reads consistently high. Similarly, the magnet in an ammeter might, over the years, become weaker and the needle may not move quite as far round the scale as might be expected. Parallax errors, described earlier, may be another example of a systematic error if one always looks from the same angle, and not directly from above, when taking a measurement. In principle, systematic errors can be corrected for by recalibrating the instrument or by correcting the technique being used.
Zero error – The zero on a ruler might not be at the very beginning of the ruler. This will introduce a fixed error into any reading unless it is allowed for. This is a type of systematic error.
Random errors – When a judgement has to be made by the observer, a measurement will sometimes be above and sometimes below the true value. Random errors can be reduced by making multiple measurements and averaging the results.
Good equipment and good technique will reduce the uncertainties introduced, but difficulties and judgements in making observations will limit the precision of your measurements. Here are two examples of how difficulties in observation will determine the uncertainty in your measurement.
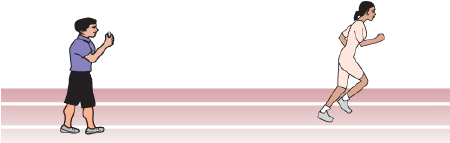
Example 1: Using a stopwatch
Tambo has a digital stopwatch that measures to the nearest one-hundredth of a second. He is timing his sister Nana in a 100 metre race (Figure P1.6). He shows her the stopwatch, which $11.87 s$. She records in her notebook the time $11.9 s$. She explains to Tambo that he cannot possibly measure to the nearest one-hundredth of a second as he has to judge both when the starting pistol was fired and the exact moment at which she crossed the finishing line. To do this to any closer than the nearest one-tenth of a second is impossible. In addition, sometimes he will press the button too early and sometimes too late.
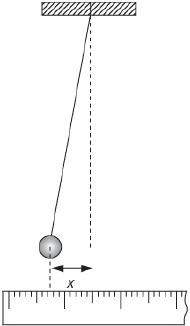
Example 2: Measuring displacement of a pendulum
Fatima is asked to measure the maximum displacement of a pendulum bob as it oscillates, as shown in Figure P1.7. She uses a ruler calibrated in millimetres. She argues that she can measure the displacement to the nearest millimetre. Joanne, however, correctly argues that she can only measure it to the nearest two millimetres, as not only is there the uncertainty at either end ($0.5 mm$) but she also has to judge precisely the point at which the bob is at its greatest displacement, which adds an extra millimetre to the uncertainty.
Questions
2) Look at Figure P1.5. Draw similar diagrams to represent:
a: a target where the holes are both precise and accurate
b: a target where the holes are neither precise nor accurate.
3) The position of the holes in Figure P1.5 represents attempts at measuring the position of the centre of the circle. Which one shows more random error and which shows more systematic error?