Physics A Level
P1 Practical skills at AS Level P1.8 Analysing results
Physics A Level
P1 Practical skills at AS Level P1.8 Analysing results
- Chapter 1: Kinematics
- Chapter 2: Accelerated motion
- Chapter 3: Dynamics
- Chapter 4: Forces
- Chapter 5: Work, energy and power
- Chapter 6: Momentum
- Chapter 7: Matter and materials
- Chapter 8: Electric current
- Chapter 9: Kirchhoff’s laws
- Chapter 10: Resistance and resistivity
- Chapter 11: Practical circuits
- Chapter 12: Waves
- Chapter 13: Superposition of waves
- Chapter 14: Stationary waves
- Chapter 15: Atomic structure
- P1 Practical skills at AS Level
- Chapter 16: Circular motion
- Chapter 17: Gravitational fields
- Chapter 18: Oscillations
- Chapter 19: Thermal physics
- Chapter 20: Ideal gases
- Chapter 21: Uniform electric fields
- Chapter 22: Coulomb’s law
- Chapter 23: Capacitance
- Chapter 24: Magnetic fields and electromagnetism
- Chapter 25: Motion of charged particles
- Chapter 26: Electromagnetic induction
- Chapter 27: Alternating currents
- Chapter 28: Quantum physics
- Chapter 29: Nuclear physics
- Chapter 30: Medical imaging
- Chapter 31: Astronomy and cosmology
- P2 Practical skills at A Level
When you have obtained your results, the next thing to do is to analyse them. Very often this will be done by plotting a graph.
You may be asked to plot a graph in a particular way, however, the general rule is that the variable you control or alter (the independent variable) is plotted on the x-axis and the variable that changes as a result (the dependent variable) is plotted on the y-axis.
In the example in Table P1.1, the length of the wire would be plotted on the x-axis and the current (or $\frac{1}{{current}}$) would be plotted on the y-axis.
You should label your axes with both the quantities you are using and their units. You should then choose your scales to use as much of the graph paper as possible. However, you also need to keep the scales simple. Never choose scales that are multiples of $3, 7, 11$ or $13$. Try and stick to scales that are simple multiples of $1, 2$ or $5$.
Plot your points carefully using small crosses; dots tend to disappear into the page and larger dots become blobs, the centre of which is difficult to ascertain.
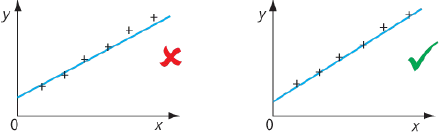
Many, but not all, graphs you meet will be straight lines. The points may not all lie exactly on the straight line and it is your job to choose the best fit line. Choosing this line is a skill that you will develop through the experience of doing practical work.
Generally, there should be equal points either side of the line (but not three on one side at one end and three on the other at the other end). Sometimes, all the points, bar one, lie on the line. The point not on the line is often referred to as an anomalous point, and it should be checked, if possible. If it still appears to be off the line it might be best to ignore it and use the remaining points to give the best line. It is best to mark it clearly as ‘anomalous’.
In Figure P1.11, the line chosen on the first graph is too shallow. By swinging it round so that it is steeper, it goes closer to more points and they are more evenly distributed above and below the line.
Deductions from graphs
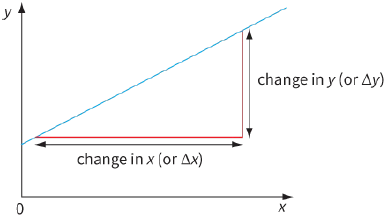
There are two major points of information that can be obtained from straight-line graphs: the gradient and the intercept with the y-axis. When measuring the gradient, a triangle should drawn, as in Figure P1.12, using at least half of the line that has been drawn.
$\begin{array}{l}
gradient = \frac{{change\,in\,y}}{{change\,in\,x}}\\
= \frac{{\Delta y}}{{\Delta x}}
\end{array}$
In the mathematical equation $y = mx + c$, m is equal to the gradient of the graph and c is the intercept with the y-axis. If c is equal to zero, the graph passes through the origin, the equation becomes $y = mx$ and we can say that y is proportional to x.
Question
14) a: Use your results from Question 13 to plot a graph of the square of the horizontal distance ${d^2}$ (on the y-axis) against the height h (on the x-axis). Draw the best fit line.
b: Determine the gradient of the line on your graph and the intercept with the y-axis. Remember, both the gradient and the intercept have units; these should be included in your answer.
Curves and tangents
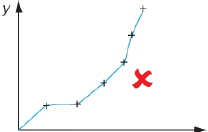
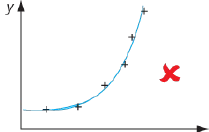
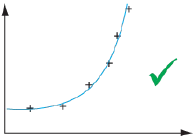
You also need to develop the skill of drawing smooth curves through a set of points, and drawing tangents to those points. When drawing curves, you need to draw a single smooth curve, without any jerks or feathering. As with a straight line, not every point will lie precisely on the curve, and there should be a balance of points on either side.
In the first graph of Figure P1.13, the student has joined each of the points using a series of straight lines.
This should never be done. The second graph is much better, although there is some feathering at the lefthand side, as two lines can be seen. The third graph shows a well-drawn curve.
|
|
|
|