Physics A Level
P1 Practical skills at AS Level P1.11 Identifying limitations in procedures and suggesting improvements
Physics A Level
P1 Practical skills at AS Level P1.11 Identifying limitations in procedures and suggesting improvements
- Chapter 1: Kinematics
- Chapter 2: Accelerated motion
- Chapter 3: Dynamics
- Chapter 4: Forces
- Chapter 5: Work, energy and power
- Chapter 6: Momentum
- Chapter 7: Matter and materials
- Chapter 8: Electric current
- Chapter 9: Kirchhoff’s laws
- Chapter 10: Resistance and resistivity
- Chapter 11: Practical circuits
- Chapter 12: Waves
- Chapter 13: Superposition of waves
- Chapter 14: Stationary waves
- Chapter 15: Atomic structure
- P1 Practical skills at AS Level
- Chapter 16: Circular motion
- Chapter 17: Gravitational fields
- Chapter 18: Oscillations
- Chapter 19: Thermal physics
- Chapter 20: Ideal gases
- Chapter 21: Uniform electric fields
- Chapter 22: Coulomb’s law
- Chapter 23: Capacitance
- Chapter 24: Magnetic fields and electromagnetism
- Chapter 25: Motion of charged particles
- Chapter 26: Electromagnetic induction
- Chapter 27: Alternating currents
- Chapter 28: Quantum physics
- Chapter 29: Nuclear physics
- Chapter 30: Medical imaging
- Chapter 31: Astronomy and cosmology
- P2 Practical skills at A Level
No experiment is perfect and the ability to see weaknesses in the experimental setup and the techniques used is an important skill. You should also take the opportunity to think of ways to improve the experimental technique, thereby reducing the overall percentage uncertainty.
In this topic, we will look at five experiments and discuss problems that might arise and the improvements that might be made to overcome them. It will help if you try out some of the experiments yourself so that you get a feel for the methods described. The table for each experiment is a summary of ideas that you might use in your answer.
Experiment 1: Ball-bearings and craters
In Worked example 2, the student dropped a ball-bearing of diameter d into sand and measured the depth D of the crater produced. He dropped two ball-bearings of different diameters from the same height and measured the depth of the crater using a $30 cm$ ruler. Table P1.7 suggests some of the problems with the simple method used, together with some improvements.
| Suggestion | Problem | Improvement |
| 1 | ‘Two results are not enough to draw a valid conclusion.’ | ‘Take more results and plot a graph of D against d.’ |
| 2 | ‘The ruler is too wide to measure the depth of the crater.’ | ‘Use a knitting needle and mark the sand level on the needle and then measure with a ruler.’ |
| 3 | ‘There may be a parallax error when measuring the top level of the crater.’ | ‘Keep the eye parallel to the horizontal level of the sand, or use a stiff card.’ |
| 4 | ‘It is difficult to release the ball-bearing without giving it a sideways velocity, leading to a distorted crater.’ |
‘Use an electromagnet to release the ball.’ |
| 5 | ‘The crater lip is of varying height.’ | ‘Always measure to the highest point.’ |
It is worth making some points regarding these suggestions.
1- This is a simple idea, but it is important to explain how the extra results are to be used. In this case, a graph is suggested – alternatively the ratio $\frac{D}{d}$ could be calculated for each set of readings.
2- The problem is clearly explained. It is not enough to just say that the depth is difficult to measure.
3- It is not enough to just say ‘parallax errors’. We need to be specific as to where they might occur.
Likewise, make sure you make it clear where you look from when you suggest a cure.
4- There is no evidence that this will affect the crater depth, but it is a point worthy of consideration.
5- An interesting point: does the crater depth include the lip or is it just to the horizontal sand surface?
Consistency in measurement is what is needed here.
Experiment 2: Timing with a stopwatch
Many years ago, Galileo suggested that heavy and light objects take the same time to fall to the ground from the same height, as illustrated in Figure P1.14. Imagine that you want to test this hypothesis.
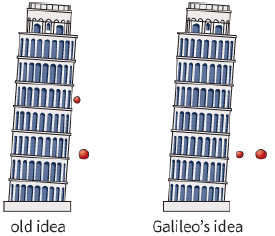
Tower of Pisa to prove his idea. But people now think it probably didn’t happen. He just did a ‘thought
.'experiment
This is an experiment you can do yourself with two objects and a stopwatch, or even a digital wrist watch or a cell phone with a timing app. Drop two different objects, for example two stones, and measure the time they take to fall the same distance to the ground.
Of course, the times you obtain are likely to be different. Does this prove Galileo wrong? You can test the relationship and establish whether your readings are consistent with his hypothesis. However, if you improve the experiment and reduce the uncertainties, the conclusion will be much more useful.
When you consider improving an experiment, first consider any practical difficulties and possible sources of inaccuracy. Write them down in detail. Do not just write, for example, ‘reaction time’ or ‘parallax error’.
It is always a good idea to start with the idea that more readings need to be taken, possibly over a greater range (for example, in this case, if the masses of the stones were almost equal). Table P1.8 gives other possibilities.
| Problem | Improvement | |
| ‘Taking readings for just two masses was not enough.’ | ‘I should use a great range of different masses and plot a graph of the average time to fall to the ground against the mass of the object.’ | |
| ‘It was difficult to start the stopwatch at the same instant that I dropped the stone and to stop it exactly as it hit the ground. I may have been late because of my reaction time.’ | ‘Film the fall of each stone with a video camera which has a timer in the background. When the video is played back, frame by frame, I will see the time when the ball hits the ground on the timer. ’(Alternatively, you can use light gates connected to a timer to measure the time electronically. You should draw a diagram, explaining that the timer starts when the first light gate is broken and stops when the second is broken.) |
|
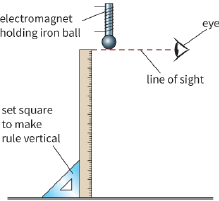
| ‘My hand was not steady and so I may not have dropped the stones from exactly the same height each time.’ | ‘Use iron objects which hang from an electromagnet. When the current in the electromagnet is switched off, the object falls.’ (A diagram would help – see Figure P.15.) |
|
| ‘The heavier stone was larger in size and it was important that the bottom of each stone started at the same height. There may have been parallax error.’ | ‘Clamp a metre rule vertically and start the bottom of each stone at exactly the top of the ruler each time. To avoid parallax error, I will make sure my line of sight is horizontal, at right angles to the rule.’ (A diagram will show this clearly – see Figure P1.15.) | |
| ‘The times that I measured were very short – not much greater than my reaction time – so reaction time had a great effect.’ | ‘Increase the distance of fall so that the times are larger. This will make the uncertainty in each time measurement smaller in proportion to the time being measured.’ | |
Question
19) Use a stopwatch and a metre rule to measure the average speed as an object falls from a table to the ground. What are the difficulties and how might they be reduced? Some of the suggestions will be the same as those in Experiment 2, but you should also consider difficulties in measuring the distance to the ground and how they can be avoided. Remember, rules have battered ends and the ends may not be at 0 and $100 cm$.
Experiment 3: Timing oscillations
In physics, the study of oscillations is of great importance. Indeed, the observation of a pendulum led Galileo to study time intervals and allowed pendulum clocks to be developed.
One skill you will need to develop is finding the time for an oscillation. Figure P1.16 shows a simple pendulum and one complete oscillation. The pendulum is just a small weight, the bob, which hangs on a string.
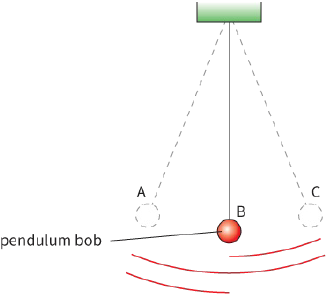
back to B, then to A and back to B, as shown
Figure P1.16 shows that one complete oscillation can be measured in two ways. Which way is better? In fact, the second way is better. This is because it is difficult to judge exactly when the pendulum bob is at the end of its swing. It is easier to start timing when the bob is moving quickly past a point; this happens in the middle of the swing. To time from the middle of the swing, you should use a fiducial mark. This can be a line on the bench underneath the bob at the centre of the swing, or it can be another object in the laboratory that appears to be in line with the bob when it hangs stationary, as seen from where you are standing. As long as you do not move your position, every time the bob passes this point it passes the centre.
Another way to reduce the uncertainty in the time for one oscillation is to time more than one swing, as explained in the topic on percentage uncertainty.
A simple practical task is to test the hypothesis that the time for one oscillation T is related to the length l of a simple pendulum by the formula ${T^2} = kl$, where k is a constant.
What difficulties would you face and what are possible improvements? Table P1.9 gives some possibilities.
| Problem | Improvement |
| ‘Taking readings for just two lengths was not enough.’ | ‘Use more than two lengths and plot a graph of the average time squared against the length of the string.’ |
| ‘It was difficult to judge the end of the swing.’ | ‘Use a fiducial mark at the centre of the oscillation as the position to start and stop the stopwatch.’ ‘Use an electronic timer placed at the centre of the oscillation to measure the time.’ ‘Make a video of the oscillation with a timer in the background and play it back frame by frame.’ |
| ‘The oscillations died away too quickly.’ | ‘Use a heavier mass which swings longer.’ |
| ‘The times were too small to measure accurately, as my reaction time was a significant fraction of the total time.’ | ‘Use longer strings.’ ‘Time 20 rather than 10 oscillations.’ |
| ‘It was difficult to measure the length to the centre of gravity of the weight accurately.’ | ‘Use a longer string so any errors are less important.’ ‘Measure the length to the top of the weight and use a micrometer to measure the diameter of the bob and add on half the diameter to the length of the string.’ |
Question
20) Hang a mass from a spring or from a rubber band. Use a stopwatch to time the mass as it oscillates up and down. Measure the time for just one oscillation, the time for 10 oscillations and the time for 20 oscillations. Repeat each reading several times. Use your readings to find the time for one complete oscillation and the uncertainty in each time. Draw up a table to show the problems of such measurements and how to reduce them.
Experiment 4: Using force meters
You need to be able to read instruments, estimating the uncertainty, looking for sources of error and trying to improve their use. One such instrument is a force meter or newton-meter, shown in Figure P1.17.
In this experiment, the block is pulled using the force meter to find the force F needed to make a block just start to move. An extra mass is added on top of the block to see whether the relationship $F = km$ is obeyed, where m is the total mass of the block and k is a constant.

P1.17. When reading the meter, the uncertainty is the smallest scale division on the meter, unless one
can reasonably read between the markings. This is difficult and so an uncertainty of $0.5 N$, the smallest
scale division, is reasonable
Another problem in using the meter is that it reads less than zero before it is pulled. It needs a small force to bring the meter to zero. This is a zero error and all the actual readings will be too large by the same amount. This is probably because the meter was adjusted to read zero when hanging vertically and it is now being used horizontally.
Fortunately, the meter can be adjusted to read zero before starting to pull.
Table P1.10 describes the problems that may be encountered with this experiment, together with suggested improvements.
| Problem | Improvement |
| ‘Taking readings for just two masses was not enough.’ | ‘Use more than two masses and plot a graph of the force against the mass.’ |
| ‘It was difficult to zero the newton-meter used horizontally.’ | ‘Use a force sensor and computer.’ ‘Use a pulley and string to connect a tray to the block. Then tip sand onto a tray until the block starts to move. The weight of the sand and tray is then the force.’ |
| ‘The reading of F was very low on the scale and gave a large percentage uncertainty.’ | ‘Use heavier masses on top of the block.’ |
| ‘The block starts to move suddenly and it is difficult to take the reading as this happens.’ | ‘Video the experiment and play back frame by frame to see the largest force.’ ‘Use a force sensor and computer.’ |
| ‘Different parts of the board are rougher than others.’ | ‘Mark round the block with a pencil at the start and put it back in the same place each time.’ |
Question
21) If you grip the bulb of a thermometer gently in your fingers, the reading rises to a new value. The reading will be different depending on whether you cover the bulb entirely or only partially with your fingers.
A laboratory thermometer can be used to measure the increase in temperature.
a: Suggest a value for the uncertainty in such a reading. (You may need to look at some different thermometers.)
b: Describe how you would test whether the temperature rise is proportional to the area of the bulb covered by your fingers You can take the surface area of the bulb to be $1c{m^2}$ and when you cover half of the bulb the area covered is $0.5c{m^2}$. The exact value of the surface area is not important;
just the ratio is important.
c: Suggest difficulties with this experiment, and how it might be improved. One problem with a thermometer is that it takes time for the reading to rise. What can you do about this?
Experiment 5: Electrical measurements
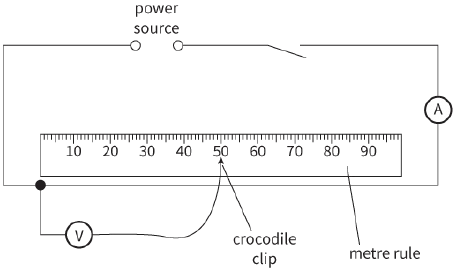
Electrical experiments have their own problems. Figure P1.18 shows an apparatus used to test the hypothesis that the resistance R of a wire is related to its length l by the formula $R = kl$, where k is a constant. The current is kept constant and the voltmeter reading is taken at two different values of l, for $l= 0.30 m$ and $0.50 m$.
What problems are likely to arise when using this apparatus? Table P1.11 identifies some possible problems with this experiment, and some suggestions for improvement.
| Problem | Improvement |
| ‘Taking readings for just two lengths was not enough.’ | ‘Use more than two lengths and plot a graph of the voltmeter reading against the length.’ ‘Calculate more than just two values of k.’ |
| ‘Difficult to measure the length of the wire as the clips have width and I don’t know where inside they grip the wire.’ | ‘Use narrower clips.’ ‘Solder the contacts onto the wire.’ |
| ‘The scale is not sensitive enough and can only measure to $0.05 V$.’ | ‘Use a voltmeter that reads to $0.01 V$.’ ‘Use a digital voltmeter.’ |
| ‘The values of voltage are small, particularly at $0.30 m$.’ | ‘Use a larger current so that when $l = 0.50 m$ the voltmeter reading is at the top of the scale.’ |
| ‘The voltmeter reading fluctuates because of contact resistance.’ | ‘Clean the wires with wire wool first.’ |
| ‘Other factors may have changed the resistance; for example, the temperature may have increased because of the current.’ | ‘Wait a long time until the wire has reached a constant temperature.’ ‘Use smaller currents, but with a more sensitive voltmeter.’ |
EXAM-STYLE QUESTIONS
1) Quantity P has a fractional uncertainty p. Quantity Q has a fractional uncertainty q.
What is the fractional uncertainty in $\frac{{{P^2}}}{{{Q^3}}}$? [1]
A: $p − $
B: $p + q$
C: $2p − 3q$
D: $2p + 3q$
2) The p.d. V across a wire of length l is given by the formula $V = \frac{{4I\rho l}}{{{d^2}}}$ where d is the diameter of the wire, $\rho $ is the resistivity and there is a current I in the wire.
Which quantity provides the largest contribution to the percentage uncertainty in V? [1]
| Quantity | Value of quantity | Absolute uncertainty | |
| A | l / cm | 250 | $ \pm 10$ |
| B | d/mm | 1.4 | $ \pm 0.1$ |
| C | $\rho /\Omega \,m$ | $1.5 \times {10^8}$ | $ \pm 0.2 \times {10^{ - 8}}$ |
| D | I / A | 2.0 | $ \pm 0.2$ |
3) What is the uncertainty in the following sets of readings? All of them are written down to the smallest division on the instrument used in their measurement.
a: $24.6, 24.9, 30.2, 23.6 cm$ [1]
b: $2.66, 2.73, 3.02 s$ [1]
c: $24.0, 24.0, 24.0 g$ [1]
[Total: 3]
4) Electrical experiments usually involve the reading of meters such as the voltmeters shown.
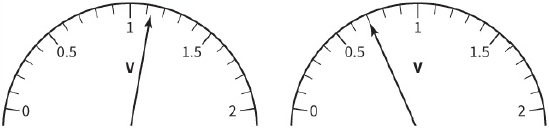
a: What is the reading shown by each voltmeter, and the uncertainty in each reading? [2]
b: The voltmeters show the readings obtained when they were connected across two wires that were identical apart from their different lengths. The current in each wire was $0.500 A$ and the length l of the wire was $30.0 cm$ in the right diagram and $50.0 cm$ in the left diagram.
Use the scale readings to test the hypothesis that the resistance R of the wire is proportional to length l. Consider the effect of the uncertainties on your conclusion. [4]
[Total: 6]
5) This apparatus can be used to test the hypothesis that T, the time taken for a ball to roll down a plane from rest, is related to the distance s by the formula ${T^2} = ks$, where k is a constant.
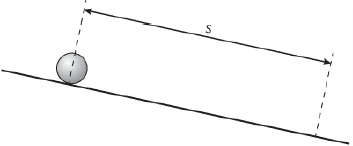
The ball is timed using a stopwatch over two different values of s.
Suggest problems with the experiment and how they might be overcome. You should consider problems in measuring the distance as well as the time. Also note what happens to the ball; it may not roll in the way that you expect. [8]
Questions 6–8 are designed to illustrate some aspects of practical questions.
They are not formal practical questions as, ideally, you should perform the experiment yourself and take some readings. This helps you to see the problems.
6) An experiment explores the relationship between the period of a vibrating spring and the mass m in a pan holder. The student is instructed to set up the
apparatus as shown here, with a mass of $200 g$ in the pan.
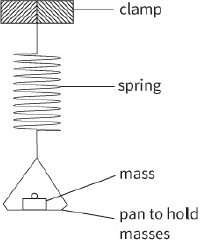
The student is then told to move the pan downwards by approximately $1 cm$ and to release it so that it vibrates in a vertical direction.
The student is asked to record the time taken for 20 oscillations of the spring, and then to repeat the procedure, using masses between $20 g$ and $200 g$ until She has six sets of readings. Columns are provided in the table for $\sqrt m $ and T, the period of the pendulum.
This table shows the readings taken by a student with the different masses.
| Mass / g | Time for 20 oscillations / s | $\sqrt m $ | T |
| 20 | 12.2 | ||
| 50 | 15.0 | ||
| 100 | 18.7 | ||
| 150 | 21.8 | ||
| 200 | 24.5 | ||
| 190 | 24.0 |
a: Copy the table and include values for $\sqrt m $ and T. [2]
b: Plot a graph of T on the y-axis against $\sqrt m $ on the x-axis. Draw the straight line of best fit. [4]
c: Determine the gradient and y-intercept of this line. [2]
d: The quantities T and m are related by the equation:
$T = C + k\sqrt m $
where C and k are constants.
Find the values of the two constants C and k. Give appropriate units. [2]
[Total: 10]
7) A student releases a toy car to roll down a ramp, as shown.
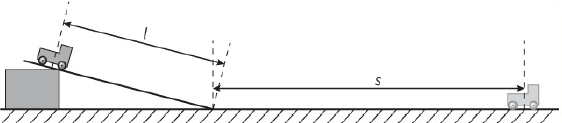
The student measures the distance l from the middle of the car as it is released to the bottom of the ramp and the distance s travelled along the straight section before the car stops. He also measures the time t taken to travel the distance s. He then repeats the experiment using a different value of l.
The student obtained readings with l = 40 and 60 cm, taking each reading for s and t twice. The readings were:
$l = 40.0 cm$: values for s were 124 and $130 cm%; values for t were 4.6 and $4.8 s$
$l = 60.0 cm$: values for s were 186 and $194 cm$; values for t were 4.9 and $5.2 s$.
a: For the smaller value of l, obtain a value for: [1]
i- the average value of s [1]
ii- the absolute and percentage uncertainty in the value of s [2]
iii- the average value of t [1]
iv- the absolute and percentage uncertainty in the value of t. [2]
b: i- For both values of l, calculate the average speed v of the car along the straight section of track using the relationship $v = \frac{s}{t}$.
ii- Justify the number of significant figures that you have given for your values of v.
c: i- It is suggested that s is proportional to l. Explain whether the readings support this relationship. [2]
ii- (HARDER) It is suggested that ${v^2}$ is proportional to l. Explain whether the readings support this relationship. [2]
d: Describe four sources of uncertainty or limitations of the procedure for this experiment. [4]
e: Describe four improvements that could be made to this experiment. You may suggest the use of other apparatus or different procedures. [4]
[Total: 20]
8: This apparatus shows a resistor in some water.
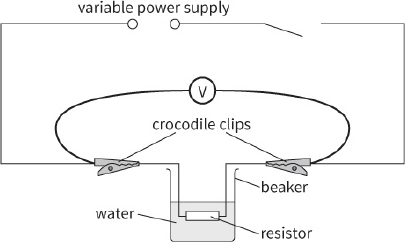
A student measures the rise in temperature $\theta $ of the water in $100 s$ using two different values of voltage.
The student wrote:
‘When the voltage was set at $6.0 V$, the rise in temperature of the water in $100s$ was ${14.5^ \circ }C$. The voltmeter reading decreased by about $0.2 V$ during the experiment, and so the final voltmeter reading was $5.8 V$.
‘The reading fluctuated from time to time by about $0.2 V$. The smallest scale division on the thermometer was ${1^ \circ }C$, but I could read it to ${0.5^ \circ }C$. I did not
have time to repeat the reading.
‘When the voltage was set at $12.0 V$, the rise in temperature in $100 s$ was ${51.0^ \circ }C$ and the voltage was almost the same at the end, but fluctuated by about $0.2V$.’
a: Estimate the percentage uncertainty in the measurement of the first voltage. [1]
b: It is suggested that θ is related to V according to the formula $\theta = k{V^2}$, where k is a constant.
i- Calculate two values for k. Include the units in your answer. [2]
ii- Justify the number of significant figures you have given for your value of k. [1]
iii- Explain whether the results support the suggested relationship. [1]
c: Describe four sources of uncertainty or limitations of the procedure for this experiment. [4]
d: Describe four improvements that could be made to this experiment. You may suggest the use of other apparatus or different procedures. [4]
[Total: 13]
SELF-EVALUATION CHECKLIST
After studying the chapter, complete a table like this:
| I can | See topic… | Needs more work | Almost there | Ready to move on |
| recognise random, systematic and zero errors | P1.2, P1.4 | |||
| distinguish between precision and accuracy | P1.4 | |||
| estimate absolute uncertainties | P1.10 | |||
| combine uncertainties | P1.5, P1.6 | |||
| make a variety of measurements and present data in an adequate table, produce best fit straight-line graphs and obtain the intercept and gradient | P1.7 | |||
| use readings to draw conclusions and to test a relationship | P1.8 | |||
| identify limitations in procedure and the main sources of uncertainty | P1.11 | |||
| suggest changes to an experiment to improve accuracy and extend the investigation. | P1.11 |