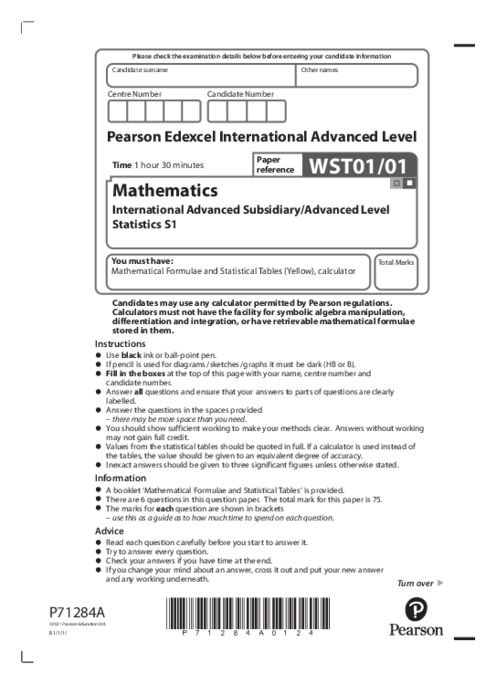
Statistics (1) WST01/01 October 2021
omer uner
1. Probability and Venn Diagrams: Solving problems related to the probability of events using Venn diagrams, independence, and conditional probability.
2. Regression and Correlation: Calculating the product moment correlation coefficient, finding the regression line, and interpreting the gradient of the regression line.
3. Probability Distributions: Solving problems involving discrete random variables, including finding the expected value, variance, and probability distributions.
4. Box Plots and Statistics: Analyzing data using box plots, calculating interquartile range (IQR), and identifying outliers in statistical data.
5. Normal Distribution: Using the properties of the normal distribution to calculate probabilities and solve real-world problems, such as finding ranges for data.
6. Stem-and-Leaf Diagrams: Interpreting and creating stem-and-leaf diagrams, and using them to analyze statistical data, including finding the median, quartiles, and IQR.
See More Unit 1 9 months ago
Statistics (WST) Subject directory
All resources in one place
Related Past Papers
Related Tutorials
Crash report
