Checkpoint Mathematics | Processing and Presenting Data Revision Note
ayesha khan
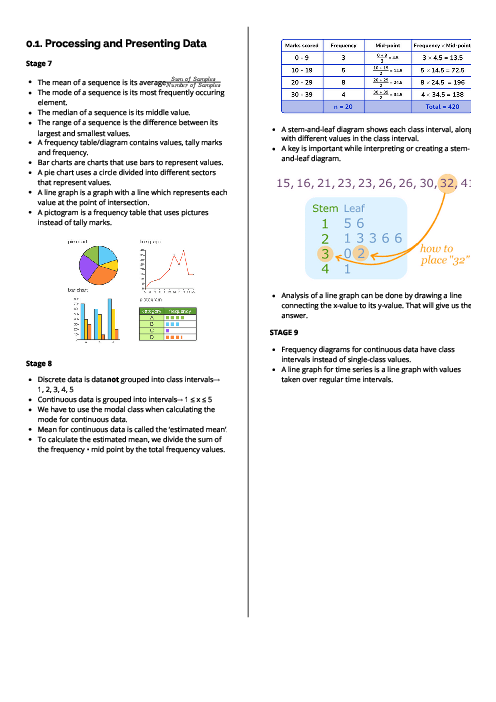
CAIE Checkpoint Mathematics guide on processing and presenting data — covers mean, median, mode, range, frequency tables, bar charts, pie charts, line graphs, pictograms, stem-and-leaf diagrams, scatter plots, and time series analysis.
See More Study and Revision Guide 5 months ago
Checkpoint Mathematics (0862) Subject directory
All resources in one place
Related Past Papers
Related Tutorials
Crash report
