Chemistry (9701) Graphs and Tables Revision Note
Hestia Laurent
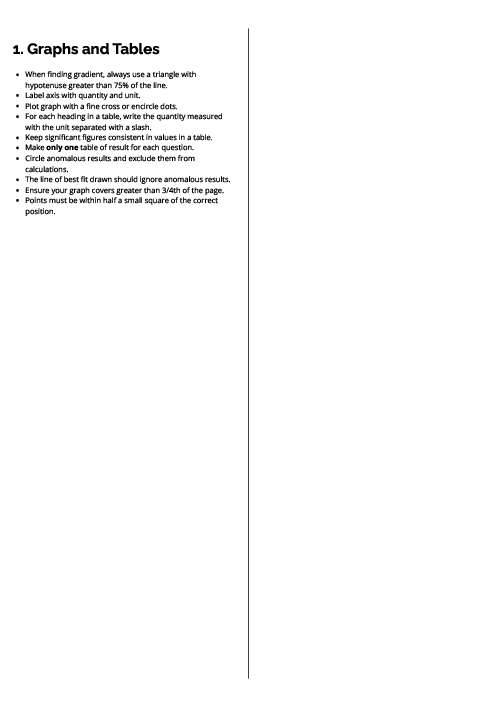
This document provides guidelines for creating accurate graphs and tables in chemistry experiments. It includes tips on labeling axes, plotting data points, calculating gradients, ensuring consistency in significant figures, and handling anomalous results. Proper presentation and organization of data in tables are also discussed for effective analysis.
See More Study and Revision Guide 6 months ago
Chemistry (9701) Subject directory
All resources in one place
Related Past Papers
Related Tutorials
Crash report
