Mathematics (9709) Representation of Data Revision Note
Hestia Laurent
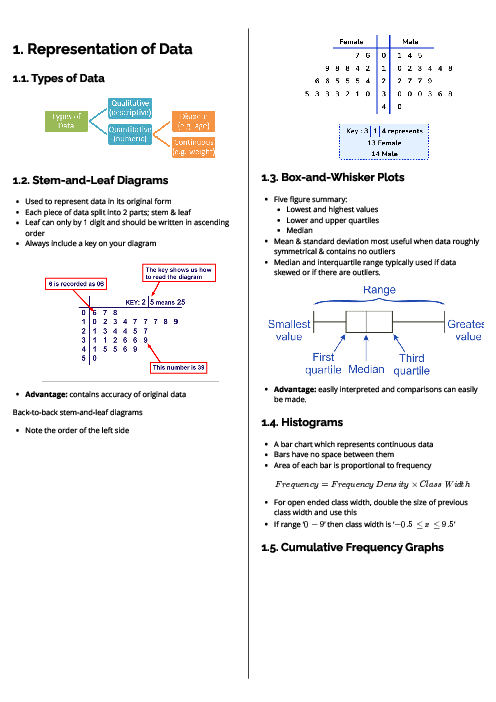
This document explains representation of data in statistics, covering types of data, stem-and-leaf diagrams, box-and-whisker plots, histograms, and cumulative frequency graphs. It highlights key concepts such as five-number summary, frequency density, class width, and measures of skewness, enabling clear interpretation, comparison of datasets, and detection of outliers.
See More Study and Revision Guide 8 months ago
Mathematics (9709) Subject directory
All resources in one place
Related Past Papers
Related Tutorials
Crash report