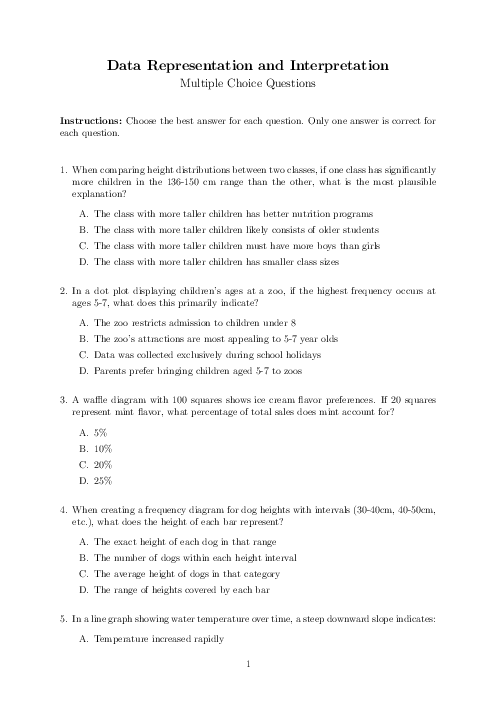
Mathematics 5 | Data - Topical Quiz
Hina Qureshi
Hard MCQs on Data Representation & Interpretation: bar charts vs histograms, line graphs, dot plots, waffle diagrams, seasonal patterns, frequency diagrams, and continuous change—real-world scenarios with step-by-step solutions and a complete answer key.
See More Topical 5 months ago
Mathematics 5 Subject directory
All resources in one place
Related Past Papers
Related Tutorials
Crash report
