Science 5th grade
Reference
Science 5th grade
Reference
Reference
This section of the Learner's Book covers some of the new scientific enquiry skills for this stage. They build on the skills already gained from previous stages. You should refer to these skills whenever you need them.
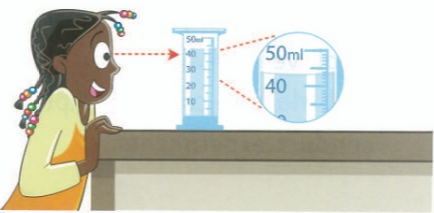
Measuring the volume of a liquid
Measuring cylinders come in different sizes. Choose one that is the right size for the volume of liquid you want to measure.
Put the measuring cylinder on a table.
Count the lines between two numbers.
On some measuring cylinders each line is 1 ml. On others it can be 2 ml or even 5 ml.
Put your eye level with the top of the liquid to read the scale.
The top of the liquid may curve. Measure to the bottom of the curve. This measuring cylinder contains 43 ml of liquid.
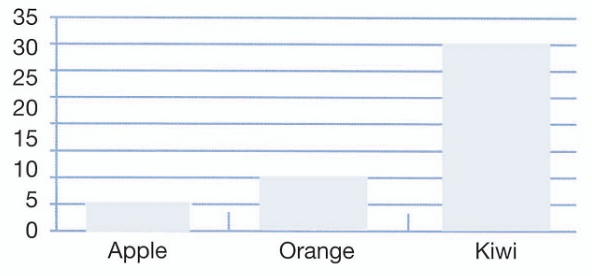
Choosing a bar chart or a line graph
Use a bar chart when your results are different objects or different groups with a number for each one. The bars are separate because each bar shows a different object or group, for example, type of fruit.
| seeds | Fruit |
| 5 | Apple |
| 10 | Orange |
| 30 | Kiwi |
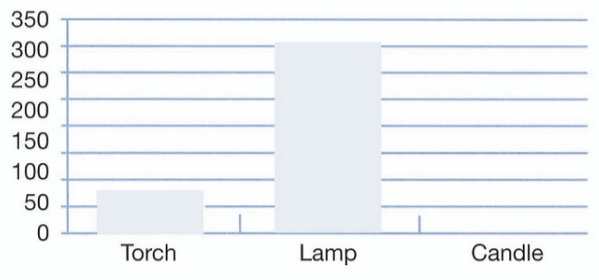
| Brightness at 10 cm | Light source |
| 80 lux | Torch |
| 300 lux | Lamp |
| 20 lux | Candle |
Use line graphs when your results are pairs of numbers.
Line graphs can be used to show how something changes with time such as an increase in temperature or plant height.
Here hot water is cooling.
| 6 | 4 | 2 | 0 | Time in minutes |
| 20 | 25 | 35 | 60 | Temperature of water in |

How to draw a line graph
Eva is measuring the length of a shadow at different times.
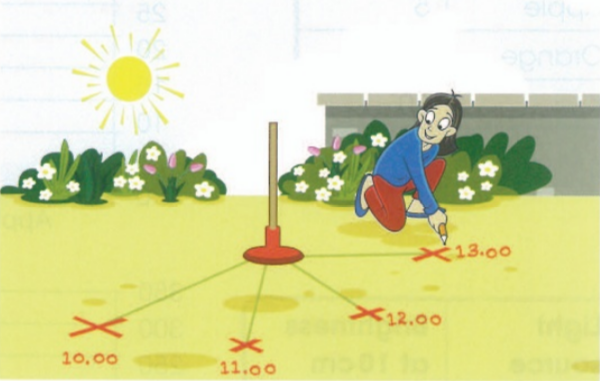
These are her results.
| 14.00 | 13.00 | 12.00 | 11.00 | 10.00 | Time in hours |
| 85 | 50 | 25 | 45 | 90 | Length of shadow in cm |
Eva wants to draw a line graph.
First she has to draw the axes.
She looks at the longest shadow length (90 cm). She draws the y axis up to 100 cm.
There are 5 different times to go on the x axis. The times are all 1 hour apart. She draws a line for the x axis.
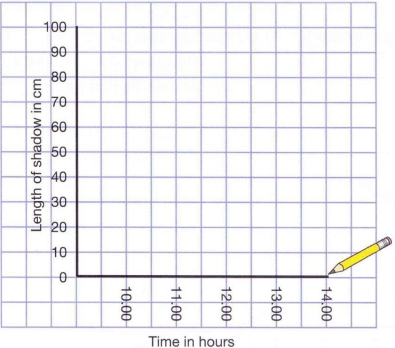
Eva uses a ruler to draw straight lines.
She writes the numbers so that the lines on the graph paper go through the middle of the numbers.
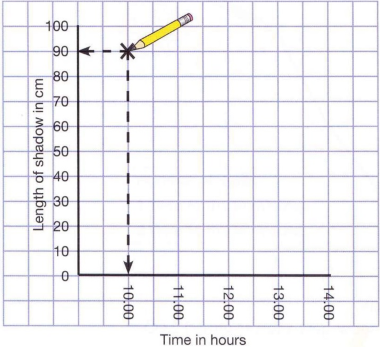
Now Eva needs to plot the results on the graph.
The first result is 90 cm at 10.00 She finds the line on the graph for 10.00.
She finds the line on the graph for 90 cm.
She makes a cross where the two lines meet.
Next Eva finds the line on the graph for 11.00 and the line for 45 cm.
She draws a cross where the two lines meet.
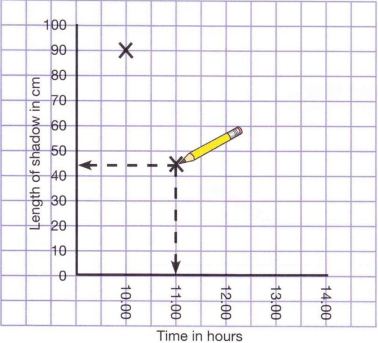
She plots all the results the same way.
Then she draws a line that goes through the crosses on the graph.
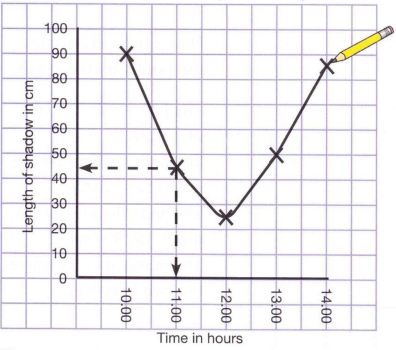
The graph shows that the shadow gets shorter until 12.00. After that it gets longer.
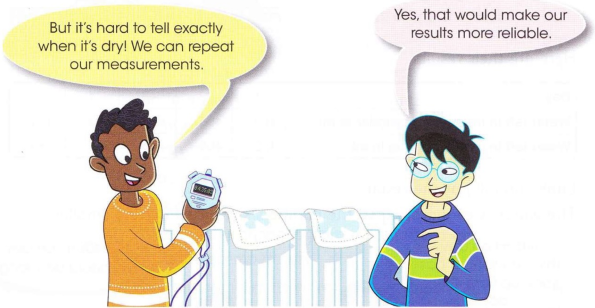
Repeating measurements to make results more reliable
Song and Mansi have a question: 'Will a paper towel that is twice as wet take twice as long to dry?'
Mansi puts five drops of water onto one paper towel. Song puts ten drops on another.
They put both the paper towels on a radiator. They use a stopwatch to time how long they take to dry.
A reliable result is a result that is close to the true answer.
They decide to repeat their measurements.
| 10 | 5 | Number of drops |
| 15 | 13 | 1 Time to dry in minutes |
| 20 | 12 | 2 Time to dry in minutes |
Mansi's two measurements are similar. Song's are not. To find out which of his results is the most reliable he can repeat the measurement again.
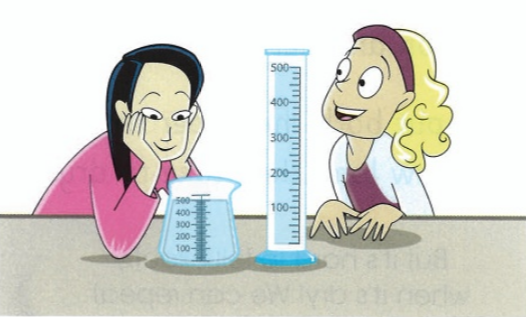
Repeating measurements to check for mistakes
Akiko and Sasha are investigating the question: 'Does the shape of a container affect how fast water evaporates?'
They have 500 ml of water in each container. They measure how much water is left in each container every day.
Here are their results.
| 5 | 4 | 3 | 2 | 1 | Day |
| 490 | 493 | 495 | 496 | 498 | Water left in measuring cylinder in ml |
| 250 | 311 | 445 | 408 | 452 | Water left in measuring jug in ml |
Look carefully at the results.
The water is evaporating so the numbers should be getting smaller.
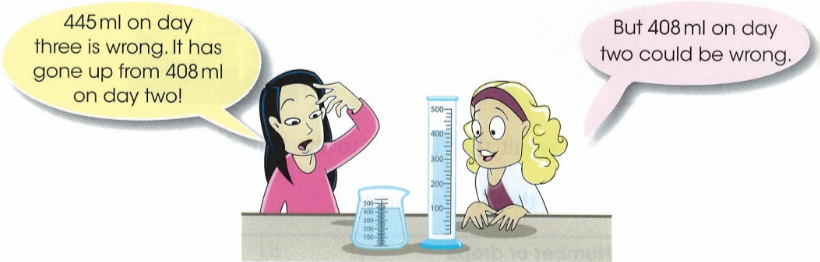
They decide to repeat the measurements to check.
| 5 | 4 | 3 | 2 | 1 | Day |
| 253 | 310 | 345 | 410 | 454 | Water left in measuring jug in ml |
The new results look correct.
The measurement of 445 ml on day 3 was wrong.