Mathematics 5th grade | UNIT 5: Handling data P74-77. Line graphs

Let's investigate
Write a story which could be represented by this graph.

1) Fatima was ill during March.
This graph is her temperature chart.
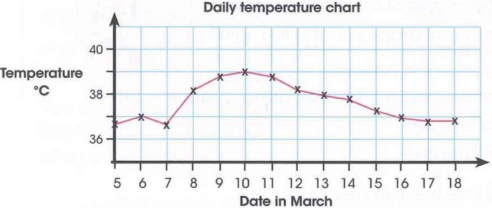
(a) A normal body temperature is ${37^ \circ }C$. What date did Fatima become ill?
(b) What was her highest temperature?
(c) How many days did it take for her temperature to return to normal?
Start counting from when her temperature reached the highest point.
2) Here are the midday temperatures in degrees Celsius in a town during 12 days in January, Draw a line graph to show this information.
| 12 | 11 | 10 | 9 | 8 | 7 | 6 | 5 | 4 | 3 | 2 | 1 | Date |
| 0 | 2- | 4- | 6- | 5- | 2- | 0 | 1 | 4 | 1 | 1 | 2 | Temperature (${0^ \circ }C$ ) |
3) Some learners went on a woodland walk every Tuesday for six weeks.
They collected acoms and pine cones. They counted how many of each they collected and recorded the result on a graph.
Explain why it is not appropriate to join the points together.

4) This graph shows the temperature in a greenhouse.

(a) What is each division worth on the vertical axis?
(b) What is each division worth on the horizontal axis?
(c) What was the time when the temperature reached ${20^ \circ }C$?
(d) What was the temperature at $1pm$?
(e) Describe what happens to the temperature during the day.
Turn the page for more questions.
5) These graphs show the attendance of Class 5 during one week.
One of the graphs does not show the data in an appropriate way.


Decide which graph is not appropriate.
Discuss your reasons with a partner, then write them down.
6) This graph shows the height of a candle as it burns.

(a) How tall was the candle when it was first lit?
(b) How many centimetres of candle burned in the first hour?
(c) What is the height of the candle after 2 hours?
(d) How long does the candle take to burn down from $18 cm$ to $4cm$?