Science 8th grade | UNIT 10: Measuring motion 10.5 Distance- time graphs booklet
Science 8th grade | UNIT 10: Measuring motion 10.5 Distance- time graphs booklet
- Unit 1: Respiration
- Unit 2: Properties of materials
- Unit 3: Forces and energy
- Unit 4: Ecosystems
- Unit 5: Materials and Cycles On Earth
- Unit 6: Light
- Unit 7: Diet and growth
- Unit 8: Chemical Reactions
- Unit 9: Magnetism
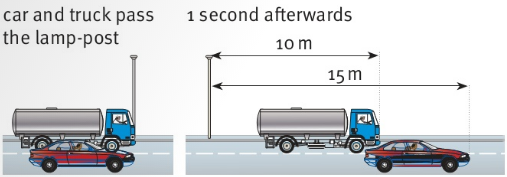
The car and the truck in the picture pass the lamp-post at the same time. After 1s, the car has travelled $15m$. The truck has travelled $10m$
Question
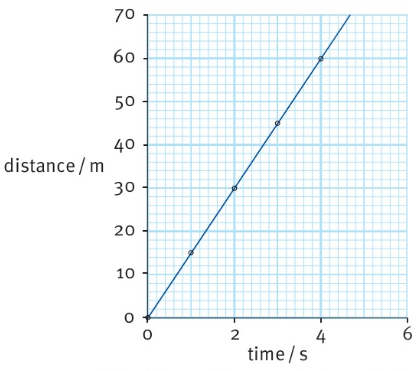
1) a: Copy the distance/time graph for the car. On the same graph, draw a distance/time graph for the truck.
It travels 10m every second.
b: From your graph, work out how long it takes the truck to travel $50m$.
Drawing distance/time graphs
We can draw a distance/time graph to represent a journey. Here is an example.
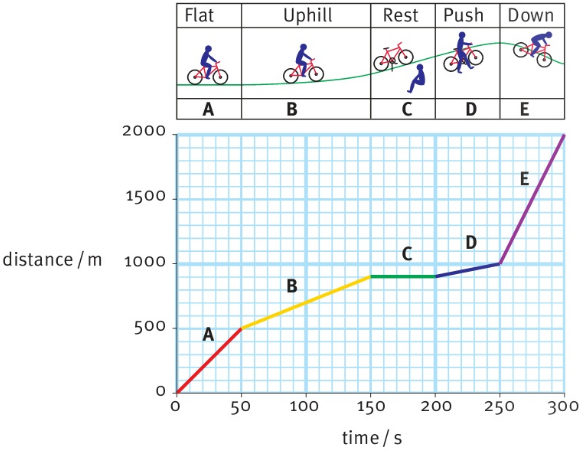
A cyclist rode up a steep hill and then down the other side. The journey is divided into five sections, A-E. The table shows how far he had travelled at the end of each stage. The information in the table has been used to draw the graph
| Distance/m | Time / S | Section of journey |
| 0 | 0 | Start |
| 500 | 50 | A |
| 900 | 150 | B |
| 900 | 200 | C |
| 1000 | 250 | D |
| 2000 | 300 | E |
Using distance/time graphs
We can use a distance/time graph to answer questions about an object's movement. Here is an example.
The graph shows the movement of a runner in a race.
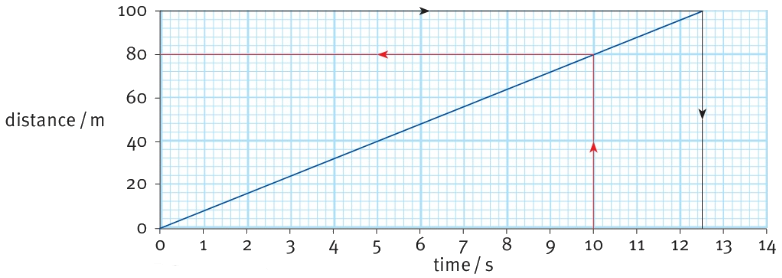
Question 1: How far has the runner travelled after $10s$? Find $10s$ on the time axis. Draw a line straight up from this point until it reaches the graph line, as shown. Now draw horizontally across to the distance axis. The answer is $80m$.
Question 2: How long does the runner take to travel $100m$? Find $100m$ on the distance axis. Draw a line horizontally from this point until it reaches the graph line, as shown. Now draw vertically down to the time axis. The answer is $12/5s$
Activity 11.5 (Journey graphs)
1) Here is some information about Mina's journey to the market. Use the information to draw up a table showing how far she had walked at different points in the journey. Then draw a distance/time graph.
Mina left home, walking slowly. After 10 minutes, she had walked $1000m$.
Then she met a friend. They stood and talked for 4 minutes.
Mina realised she might be late. She ran the next $2000m$ to the market and arrived there 30 minutes after leaving home.
2) Draw a distance/time graph for a journey similar to Mina's. It might be a journey on a bus or plane. Swap your graph with a partner.
From your partner's graph, draw a table of distances and times for the journey. Then write a description of the journey, in words.