Mathematics 7th grade | UNIT 15: Time 15.3 Real-life graphs
Graphs can tell stories.
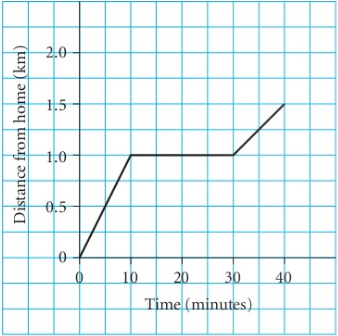
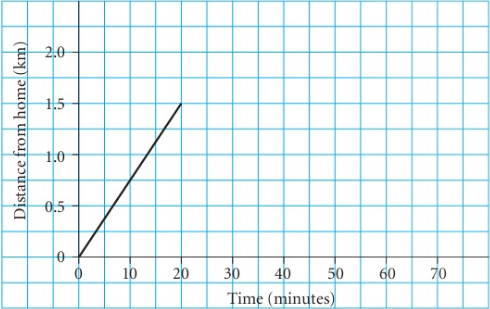
This graph shows Ari's journey from home.
First look at the two axes.
The horizontal axis shows time (in minutes).
The vertical axis shows Ari's distance from home (in kilometres).
The graph is in three parts.
• He walks for 10 minutes and travels $1 km$.
• He waits for a bus for 20 minutes. You can tell he is not moving because the line is horizontal.
• The bus does not come. He starts walking again. After a total of 40 minutes he is $1/5 km$ from home.
In the first part, Ari took 5 minutes to walk $0/5 km$. In the third part he took 15 minutes to walk $0/5 km$.
He walked more slowly in the third part. You can see this on the graph. When the graph is steeper (first part) he is walking faster. When the graph is less steep (third part) he is walking more slowly.
Exercise 15.3
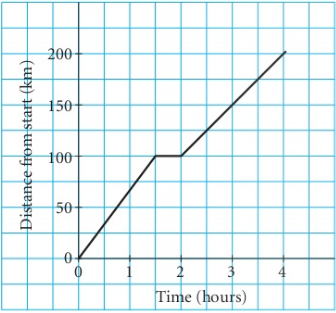
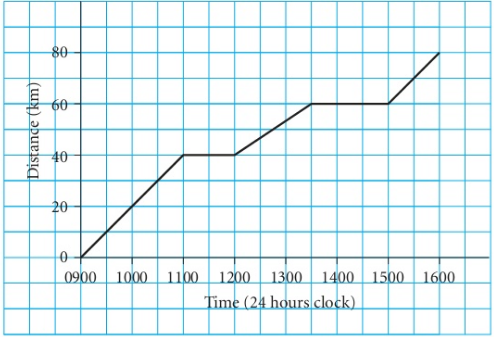
1) This graph shows a car journey.
The journey was in two stages with a rest break.
a: Work out the time taken for the first part of the journey.
b: Work out the distance the car travelled in the first part.
c: Work out the time taken for the rest break.
d: Work out the time taken for the whole journey.
e: Work out the total distance travelled.
f: Did the car travel more quickly in the first stage or the last stage? Give a reason for your answer.
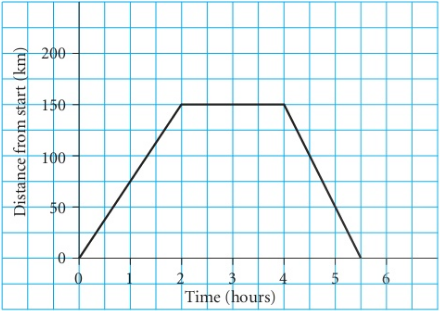
2) Luis drove to Overton.
He stayed there for a while and then he drove back home. The graph shows his journey.
a: Work out the distance from Luis's home to Overton.
b: Work out how long Luis was at Overton.
c: Find: i- the time taken to reach Overton.
ii- the time taken to get back home from Overton.
d: Did Luis drive faster travelling to Overton or going home?
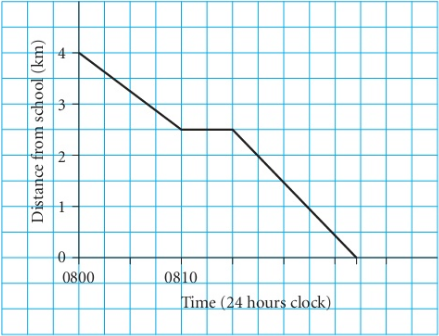
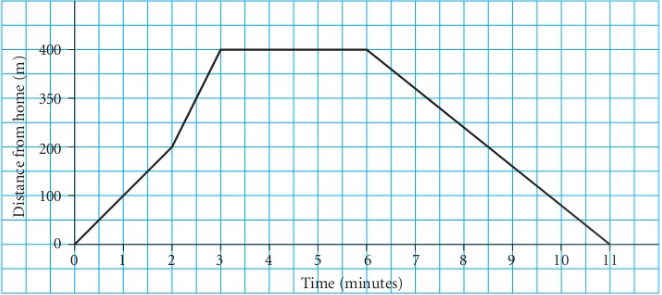
3) Maya likes to run from home to school.
This graph shows her journey one morning.
a: How far from school is Maya's home?
b: When did Maya leave home?
c: Maya stopped for a rest on the way.
i- When did she stop?
ii- How long did she stop for?
d: When did she get to school?
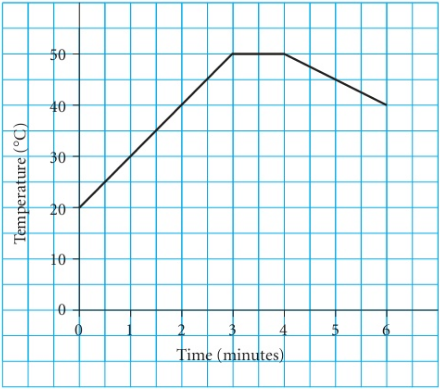
4) In an experiment Salman heated some water.
The graph shows how the temperature changed.
a: What was the temperature at the start?
b: What was the temperature after 2 minutes?
c: What was the highest temperature?
d: What happened after 4 minutes?
5) Leia went on a cycle ride.
This graph shows her progress.
a: What time did Leia start?
b: How far had Leia travelled at $10:30$?
c: Lcia had two rest stops. What times were these?
d: How far did Leia travel in the first five hours?
e: How far did Leia cycle?
f: How long did the journey take her?
6) Eva was walking to the bus stop.
After two minutes she started to run. She stopped at the bus stop.
a: How far had Eva walked when she started to run?
b: How long did it take Eva to get to the bus stop?
c: What do you think happened next?
7) Aziz walks from home to a shop.
The journey is shown on the graph.
The walk takes 20 minutes.
a: Find the distance to the shop.
b: Copy the graph.
c: Aziz is in the shop for 20 minutes.
Show this on the graph.
d: Aziz takes 30 minutes to walk home.
Show this on the graph.
8) Misha left home in his car at $10:30$. It took 2 hours to drive $50 km$ and then he stopped for one hour.
Then he drove back home. The journey home took $1\frac{1}{2}$ hours.
a: Draw a graph to show Misha's journey.
b: What time did Misha get home?
9) Johanna went on a cycle ride. She started at $9:15 am$. She rode for 2 hours and travelled $30 km$. She stopped for 1 hour. She cycled for another $2\frac{1}{2}$ hours and travelled another $40 km$.
a: Draw a graph to show her journey.
b: Work out when she finished.