Physics A Level | Chapter 12: Waves 12.1 Describing waves
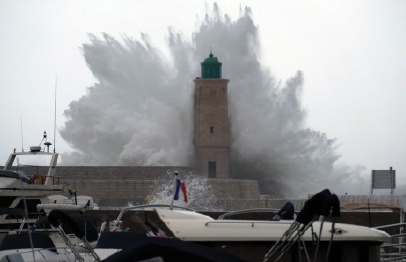
When you pluck the string of a guitar, it vibrates. The vibrations create a wave in the air that we call sound. In fact, all vibrations produce waves of one type or another (Figure 12.2). Waves that move through a material (or a vacuum) are called progressive waves. A progressive wave transfers energy from one position to another.
At the seaside, a wave is what we see on the surface of the sea. The water moves around and a wave travels across the surface. In physics, we extend the idea of a wave to describe many other phenomena, including light, sound and so on. We do this by imagining an ideal wave, as shown in Figure 12.3 – you will never see such a perfect wave on the sea!

caused by the reflection and refraction of light waves by water droplets in the atmosphere
wavelength
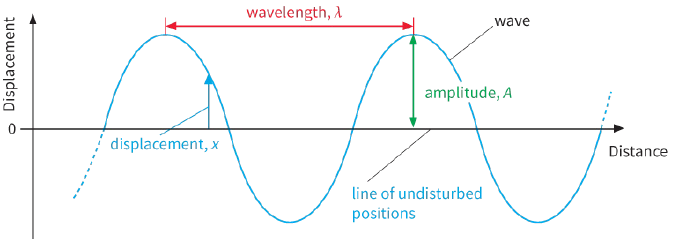
Figure 12.3, or a similar graph of displacement against time, illustrates the following important definitions about waves and wave motion.
- The distance of a point on the wave from its undisturbed position, or equilibrium position, is called the displacement x.
- The maximum displacement of any point on the wave from its undisturbed position is called the amplitude A. The amplitude of a wave on the sea is measured in units of distance, such as metres.
- The greater the amplitude of the wave, the louder the sound or the rougher the sea.
- The distance between two adjacent points on a wave oscillating in step with each other is called the wavelength $\lambda $ (the Greek letter lambda). This is the same as the distance between two adjacent peaks or troughs. The wavelength of a wave on the sea is measured in units of distance, such as metres.
- The time taken for one complete oscillation of a point in a wave is called the period T. It is the time taken for a point to move from one particular position and return to that same position, moving in the same direction. It is measured in units of time, such as seconds.
- The number of oscillations per unit time of a point in a wave is called its frequency f. For sound waves, the higher the frequency of a musical note, the higher is its pitch. Frequency is measured in hertz (Hz), where $1\,Hz = 1$ oscillation per second ($1\,kHz = {10^3}\,Hz$ and $1\,MHz = {10^6}\,Hz$).
The frequency f of a wave is the reciprocal of the period T:
$f = \frac{1}{T}$
Waves are called mechanical waves if they need a substance (medium) through which to travel.
Sound is one example of such a wave. Other cases are waves on stretched strings, seismic waves and water waves (Figure 12.4).

PRACTICAL ACTIVITY 12.1
Measuring frequency
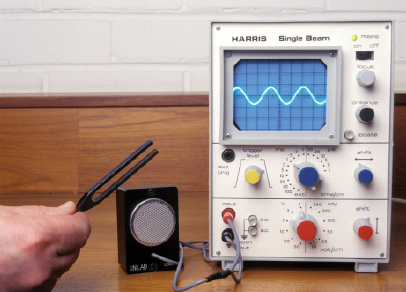
You can measure the frequency of sound waves using a cathode-ray oscilloscope (CRO) or oscilloscope for short. Figure 12.6 shows how.
A microphone is connected to the input of the CRO. The microphone converts the sound waves into a varying voltage that has the same frequency as the sound waves. This voltage is displayed on the CRO screen.
It is best to think of a CRO as a voltmeter that is capable of displaying a rapidly varying voltage. To do this, its spot moves across the screen at a steady speed, set by the time-base control. At the same time, the spot moves up and down according to the voltage of the input.
Hence, the display on the screen is a graph of the varying voltage on the (vertical) y-axis, with time on the (horizontal) x-axis. If we know the horizontal scale, we can determine the period and hence the frequency of the sound wave. Worked example 1 shows how to do this. (In Chapter 14 we will look at one method of measuring the wavelength of sound waves.)
Questions
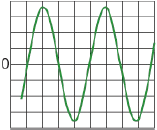
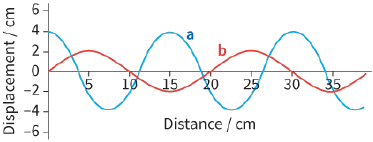
1) Determine the wavelength and amplitude of each of the two waves shown in Figure 12.5.
2) A microphone detects sound waves. The microphone is connected to a CRO. On the CRO screen, two complete cycles occupy five scale divisions along the x-axis. The calibrated time-base is set on $0.005\,s\,di{v^{ - 1}}$.
Determine the frequency of the sound waves.